


Crypto Price Chart: What Is It? How To Read Values? All You Need To Know
How to read crypto chart prices? What is a Japanese Candlestick? What are support and resistance in the crypto chart? Read on to find out all these and more.

With the rapid penetration of cryptocurrency across the world, more and more people and investors are paying attention to doing business in the crypto industry. Charts play a very significant role in any investor's life as the crypto market is considered very volatile and prices keep fluctuating at a high-speed rate. However, crypto charts are different from other economic or business charts. But, before we dive deep into understanding how to read crypto chart prices, we need to know what a crypto chart is.
What is a Crypto Chart?
Crypto charts are graphical representations of fluctuating prices, volumes, time intervals, losses, and gains among several other indicators like trading pair, period, and trading platform. Charts prove to be of immense help in predicting the future direction of the crypto market and understanding the current trends in the industry. It assists investors in making smart and timely choices of investing in cryptocurrency. Here, we help you understand how to read the crypto chart. Let's begin with a Japanese Candlestick chart.
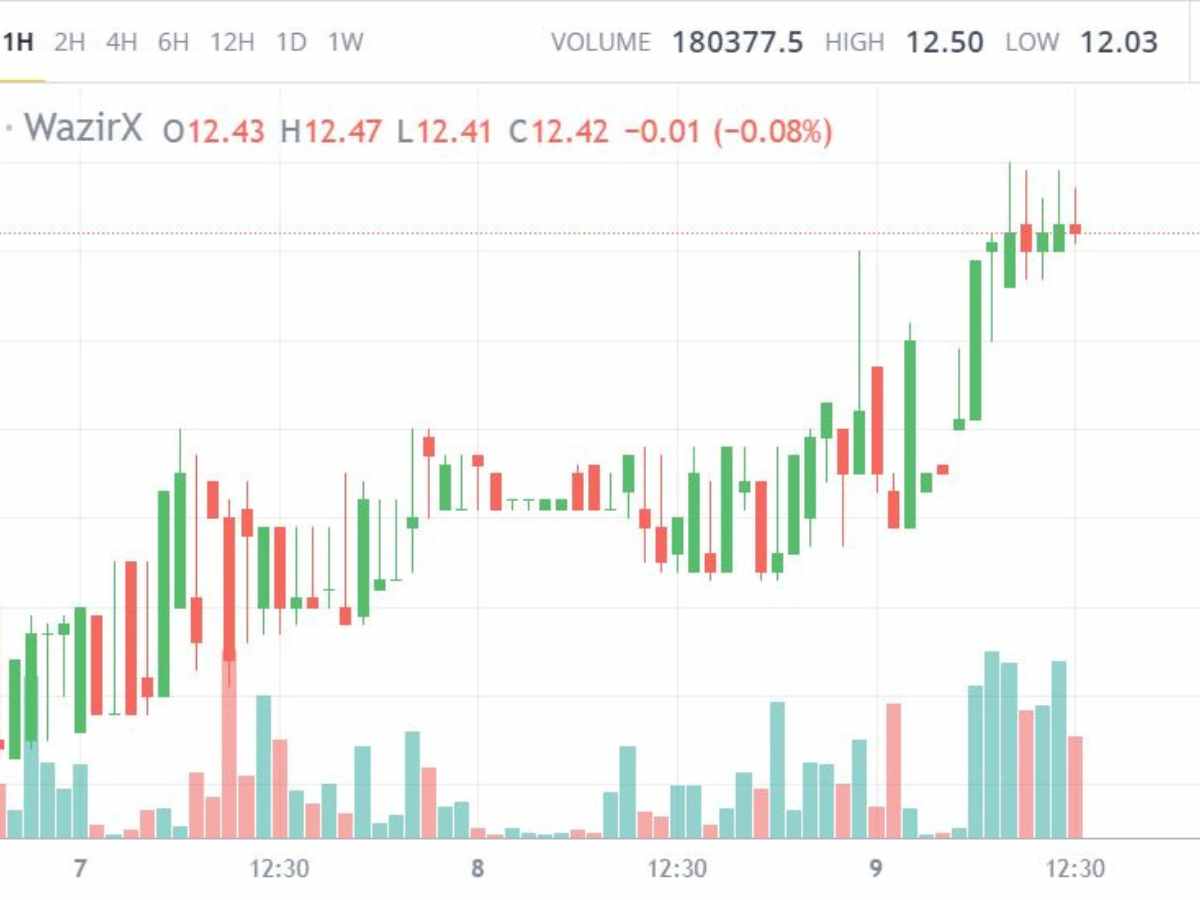
Image credit: WazirX
A Japanese Candlestick is one of the most frequently referred-to crypto charts by traders and investors. There are two candles on a crypto chart: one represents a red candle and the other a green candle.
ALSO READ: NFT Platform SuperRare Slashes 30 Percent Of Its Workforce: Here's Why
The red candle indicates the closing price to be lower than the starting price during a specific time frame. To put it in simpler terms, this means a decline in price. The green candle represents the closing price being more than the starting price, and this means an increase in the price of any particular asset. Both these candlesticks form different types of patterns on the chart.
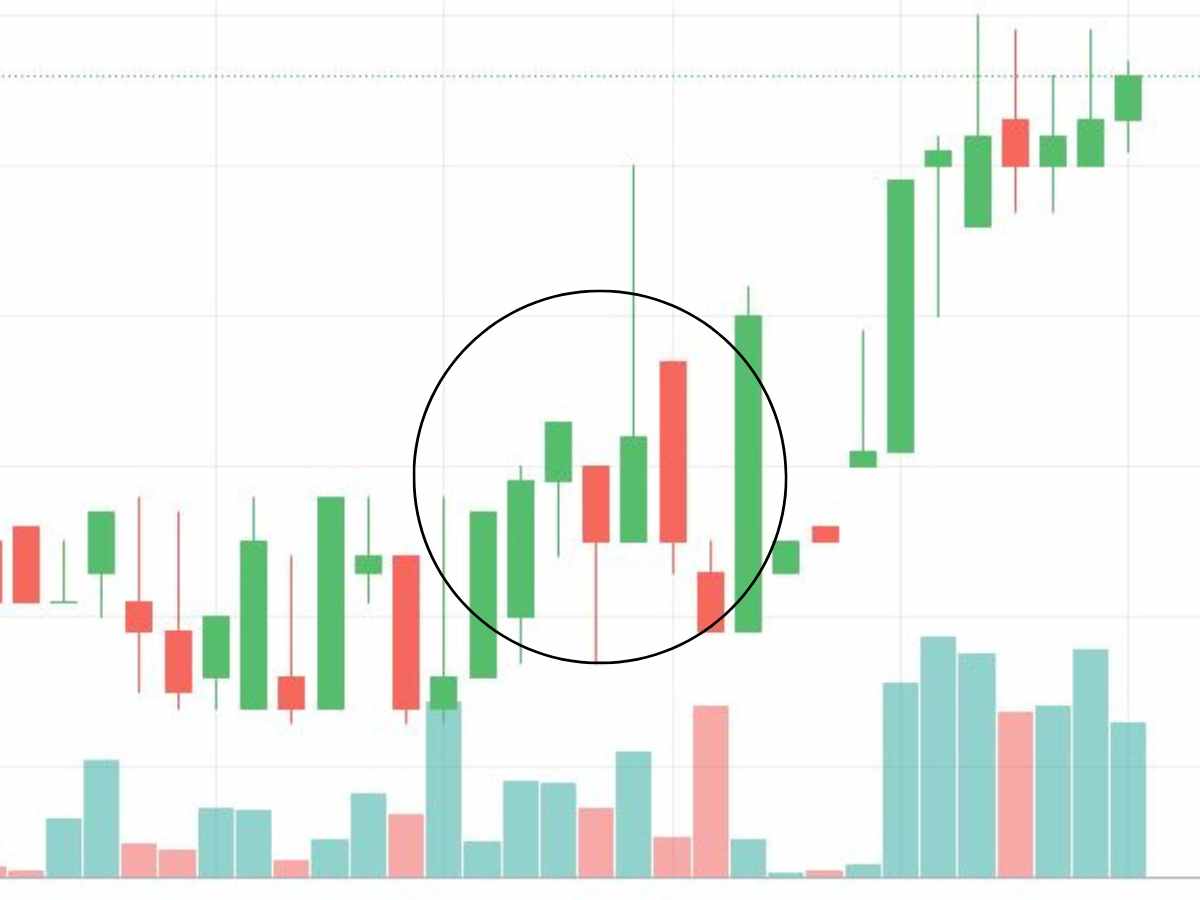
Image credit: WazirX
What are the different patterns you should keep in mind?
There are two categories or patterns on the crypto chart: Bullish Reversal Patterns and Bearish Reversal Patterns.
Hammer Candle Pattern
Bullish reversal patterns are also termed hammer candle patterns. This indicates that the stock is approaching the bottom area on a downward trend. The short body of the candle indicates the head of the hammer, and the bigger wick is an indication of sellers pushing the prices toward the bottom while trading. The bottom wick is called the handle of the hammer, and the rest candle body is known as the head of the hammer.
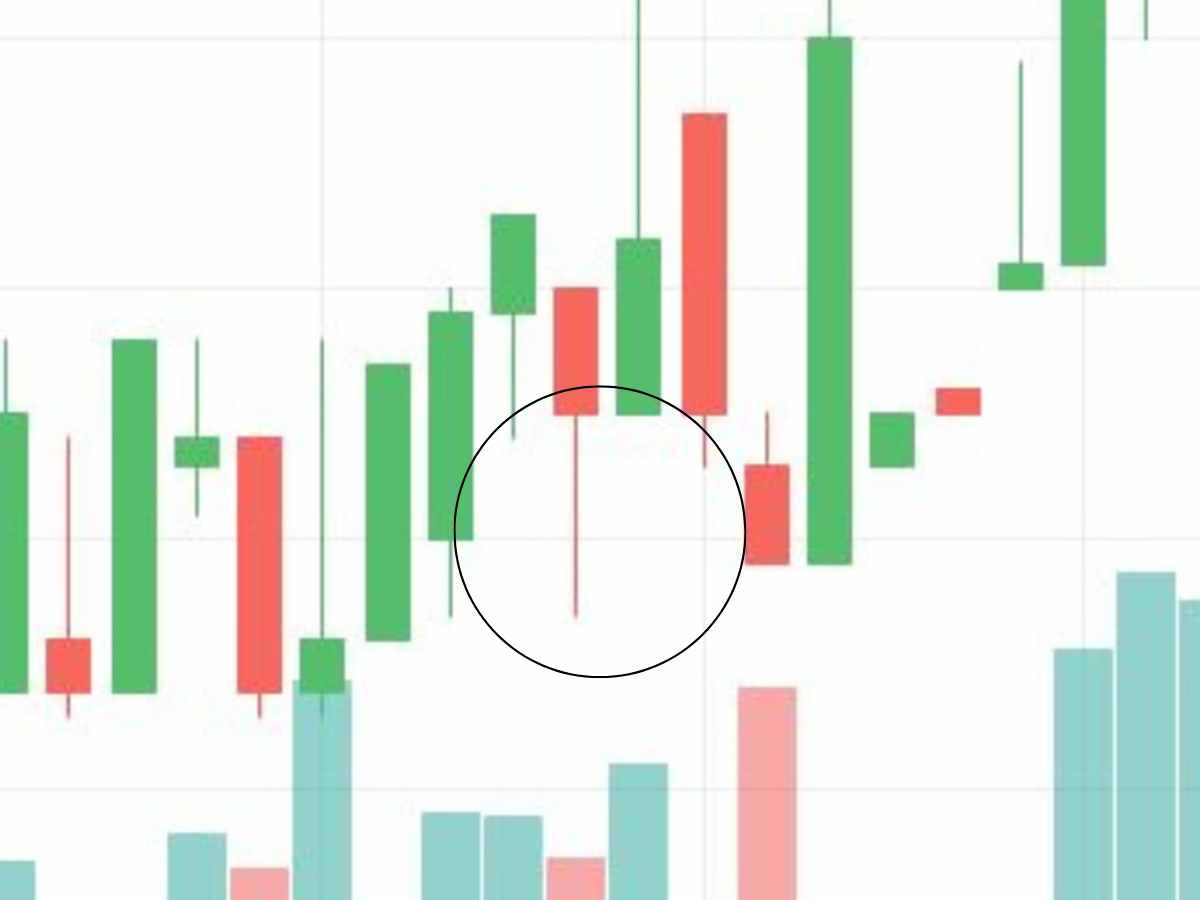
Image credit: WazirX
Bearish Reversal Patterns
Every bullish reversal pattern comes with a bearish reversal pattern. These are visible only at the height of a rally right before the reverse down. In simple terms, these patterns appear at the peak of an upward trend just before the market movement starts to go down. These are also known as the shooting star candle pattern which shows a long upper wick and a comparatively small candle body.
What are head and shoulder patterns?
Head and shoulders fall in the category of popular chart patterns for technical analysis. These are several patterns that are displayed at the peak or bottom of a trend. They are called an inverted head and shoulders pattern if they appear at the bottom of the trend. Such patterns represent a tug-of-war between the sellers and the buyers, with both sides being in opposite directions. It causes pushback and pullback phenomena.
ALSO READ: Budget 2023: What Awaits The Crypto Sector? Everything You Need To Know
What are wedges?
Wedges indicate the settling down of trends, which finally leads to a breakout. This breakdown happens in the opposite direction of the other emerging trend that is gaining momentum. Markets that move sideways wedge back and forth until they go in a certain direction.
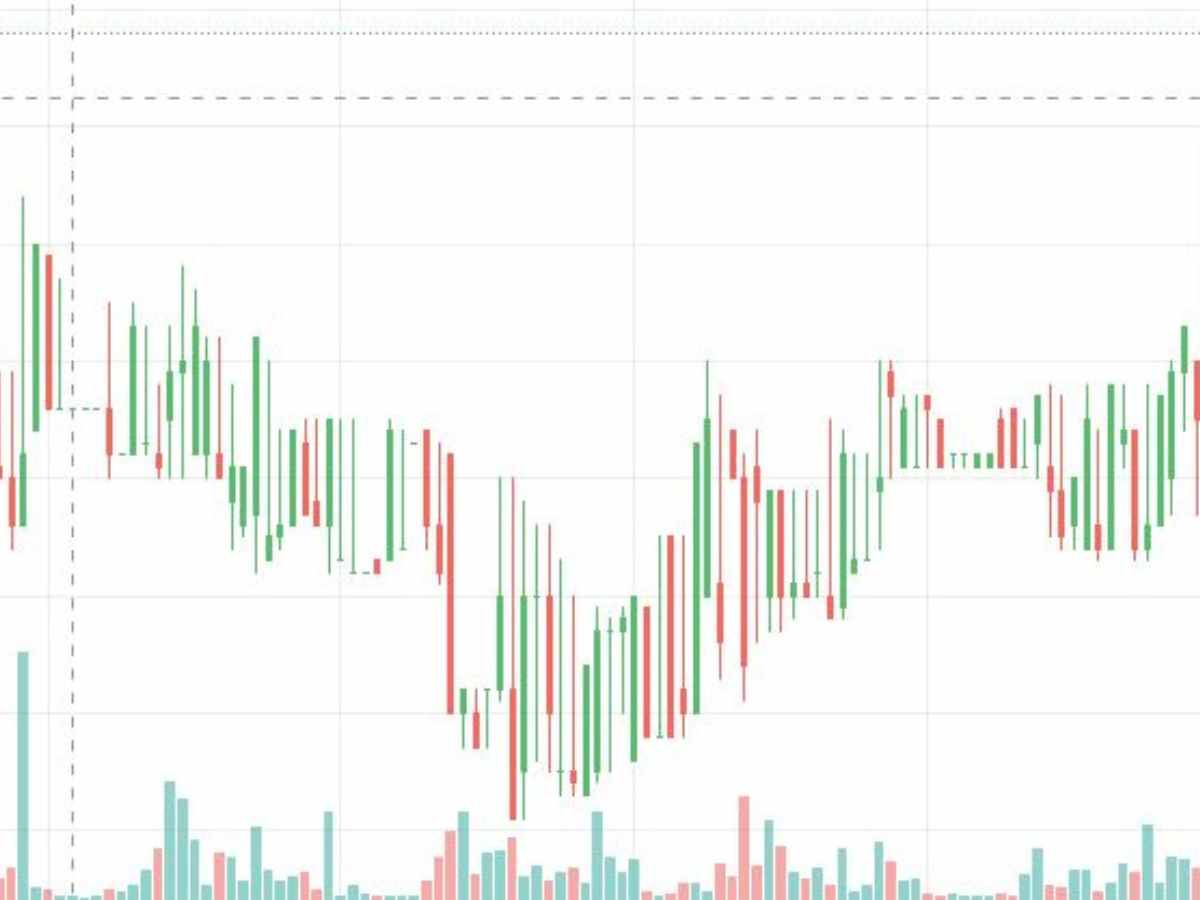
Image credit: WazirX
What Are Support And Resistance?
Support levels on the crypto chart mean that the price of a specific asset will not go down for a fixed period of time. On the other hand, the resistance level increases the price level of an asset beyond which it is not expected to rise.
Disclaimer: Crypto products and NFTs are unregulated and can be highly risky. There may be no regulatory recourse for any loss from such transactions. Cryptocurrency is not a legal tender and is subject to market risks. Readers are advised to seek expert advice and read offer document(s) along with related important literature on the subject carefully before making any kind of investment whatsoever. Cryptocurrency market predictions are speculative and any investment made shall be at the sole cost and risk of the readers.
Top Headlines