


From Ballot To Stocks, Lok Sabha Elections Fuel Market Volatility. Spot The Current Trends
The India VIX, a marker of market volatility, reflected these fluctuations, showing a significant uptick preceding both the 2014 and 2019 elections

With the Lok Sabha elections underway, the Indian stock market once again finds itself caught in the whirlwind of electoral volatility. Historically, each election year has seen a unique trend in the stock market, influenced by the ebb and flow of political anticipation.
2014
In the 2014 Lok Sabha elections, conducted over nine phases from April 7 to May 12, the market experienced a significant surge. Nifty, standing at 6,041 points on February 10, catapulted to 6,776 points by April 7, paralleled by the Sensex rising from 20,414 to 22,628 points. However, the following weeks saw a relatively stable period until a renewed rally from April 28 to May 19, driving Nifty to 7,367 points and the Sensex to 24,693 points.
2019
Fast forward to the 2019 elections, conducted over seven phases from April 11 to May 19, and a similar pattern emerged. The market surged prior to the elections, with Nifty climbing from 10,738 to 11,752 points between February 18 and April 15, while the Sensex rose from 37,462 to 39,714 points. During the voting period, a temporary decline ensued, followed by a post-election resurgence propelling Nifty to 11,922 points and the Sensex to 39,714 points by May 27.
The India VIX, a marker of market volatility, reflected these fluctuations, showing a significant uptick preceding both the 2014 and 2019 elections.
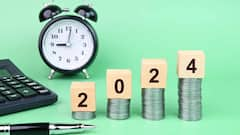
2024
In the current electoral cycle, spanning seven phases from April 19 to June 1, and with results slated for June 4, the market has already displayed its characteristic sensitivity. Before the elections, Nifty surged from 21,839 to 22,753 points by April 10, alongside the Sensex's rise from 72,101 to 75,038 points. However, subsequent weeks saw a downturn, with Nifty and Sensex slipping to 21,995 and 72,488 points respectively by April 18.
Currently, Nifty oscillates between 22,750 and 22,800 points, while the Sensex fluctuates between 72,000 and 75,100 points.
As the electoral drama unfolds, market participants remain keenly attuned to the political pulse, navigating the waves of uncertainty and opportunity that accompany every ballot cast.
Voting took place on Monday for a total of 96 Lok Sabha seats across 10 states and Union Territories, including Bihar, Jharkhand, Jammu & Kashmir, West Bengal, and Madhya Pradesh.
Closing Bell
Meanwhile, in the financial markets, both the S&P BSE Sensex and the Nifty 50 experienced a decline of nearly 1 per cent each in the morning. Additionally, the India VIX surged by over 14 per cent during intra-day trading. During the latter part of the day, Sensex and Nifty recouped their losses and closed in the green. On Monday, the BSE Sensex jumped 112 points to close at 72,776, while the NSE Nifty settled 49 points up at 22,104.
Markets At A Glance in 2014, 2019 & 2024
|
Date |
Price |
Open |
High |
Low |
|
May 13, 2024 |
72,329.34 |
72,476.65 |
72,596.58 |
71,871.62 |
|
May 10, 2024 |
72,664.47 |
72,475.45 |
72,945.23 |
72,379.67 |
|
May 09, 2024 |
72,404.17 |
73,499.49 |
73,499.49 |
72,334.18 |
|
May 08, 2024 |
73,466.39 |
73,225.00 |
73,684.93 |
73,073.92 |
|
May 07, 2024 |
73,511.85 |
73,973.30 |
74,026.80 |
73,259.26 |
|
May 06, 2024 |
73,895.54 |
74,196.68 |
74,359.69 |
73,786.29 |
|
May 03, 2024 |
73,878.15 |
75,017.82 |
75,095.18 |
73,467.73 |
|
May 02, 2024 |
74,611.11 |
74,391.73 |
74,812.43 |
74,360.69 |
|
Apr 30, 2024 |
74,482.78 |
74,800.89 |
75,111.39 |
74,346.40 |
|
Apr 29, 2024 |
74,671.28 |
73,982.75 |
74,721.15 |
73,922.34 |
|
Apr 26, 2024 |
73,730.16 |
74,509.31 |
74,515.91 |
73,616.65 |
|
Apr 25, 2024 |
74,339.44 |
73,572.34 |
74,571.25 |
73,556.15 |
|
Apr 24, 2024 |
73,852.94 |
73,957.57 |
74,121.61 |
73,788.61 |
|
Apr 23, 2024 |
73,738.45 |
74,048.94 |
74,059.89 |
73,688.31 |
|
Apr 22, 2024 |
73,648.62 |
73,666.51 |
73,767.80 |
73,227.32 |
|
Apr 19, 2024 |
73,088.33 |
71,999.65 |
73,210.17 |
71,816.46 |
Election Dates 2019
First phase – 11 April
Last Phase – 19 May
Counting of Vote – 23 May
|
Date |
Price |
Open |
High |
Low |
|
May 31, 2019 |
39,714.20 |
39,998.91 |
40,122.34 |
39,374.24 |
|
May 30, 2019 |
39,831.97 |
39,580.28 |
39,911.92 |
39,500.56 |
|
May 29, 2019 |
39,502.05 |
39,714.27 |
39,767.93 |
39,420.50 |
|
May 28, 2019 |
39,749.73 |
39,765.64 |
39,828.65 |
39,498.65 |
|
May 27, 2019 |
39,683.29 |
39,536.23 |
39,821.94 |
39,353.16 |
|
May 24, 2019 |
39,434.72 |
39,076.28 |
39,476.97 |
38,824.26 |
|
May 23, 2019 |
38,811.39 |
39,591.77 |
40,124.96 |
38,651.61 |
|
May 22, 2019 |
39,110.21 |
39,086.21 |
39,249.08 |
38,903.87 |
|
May 21, 2019 |
38,969.80 |
39,449.45 |
39,571.73 |
38,884.85 |
|
May 20, 2019 |
39,352.67 |
38,701.18 |
39,412.56 |
38,570.04 |
|
May 17, 2019 |
37,930.77 |
37,494.42 |
38,001.13 |
37,415.36 |
|
May 16, 2019 |
37,393.48 |
37,179.13 |
37,518.94 |
37,052.30 |
|
May 15, 2019 |
37,114.88 |
37,539.05 |
37,559.67 |
37,047.87 |
|
May 14, 2019 |
37,318.53 |
37,146.58 |
37,572.70 |
36,956.10 |
|
May 13, 2019 |
37,090.82 |
37,491.30 |
37,583.57 |
36,999.84 |
|
May 10, 2019 |
37,462.99 |
37,632.36 |
37,721.98 |
37,370.39 |
|
May 09, 2019 |
37,558.91 |
37,747.91 |
37,780.46 |
37,405.40 |
|
May 08, 2019 |
37,789.13 |
38,244.18 |
38,248.57 |
37,743.07 |
|
May 07, 2019 |
38,276.63 |
38,815.46 |
38,835.54 |
38,236.18 |
|
May 06, 2019 |
38,600.34 |
38,719.33 |
38,719.33 |
38,509.79 |
|
May 03, 2019 |
38,963.26 |
39,009.55 |
39,172.76 |
38,920.17 |
|
May 02, 2019 |
38,981.43 |
39,036.51 |
39,189.95 |
38,882.99 |
|
Apr 30, 2019 |
39,031.55 |
39,056.92 |
39,105.88 |
38,753.46 |
|
Apr 26, 2019 |
39,067.33 |
38,865.83 |
39,103.16 |
38,765.33 |
|
Apr 25, 2019 |
38,730.86 |
39,101.78 |
39,262.22 |
38,663.98 |
|
Apr 24, 2019 |
39,054.68 |
38,672.63 |
39,095.35 |
38,571.00 |
|
Apr 23, 2019 |
38,564.88 |
38,771.27 |
38,832.61 |
38,518.26 |
|
Apr 22, 2019 |
38,645.18 |
39,158.22 |
39,158.22 |
38,585.65 |
|
Apr 18, 2019 |
39,140.28 |
39,420.04 |
39,487.45 |
39,083.16 |
|
Apr 16, 2019 |
39,275.64 |
39,040.30 |
39,364.34 |
39,038.81 |
|
Apr 15, 2019 |
38,905.84 |
38,805.54 |
38,976.58 |
38,780.08 |
|
Apr 12, 2019 |
38,767.11 |
38,692.06 |
38,818.87 |
38,554.79 |
|
Apr 11, 2019 |
38,607.01 |
38,621.58 |
38,649.98 |
38,460.25 |
Election Dates 2014
First phase – 7 April
Last Phase – 12 May
Counting of Vote – 16 May
|
Date |
Price |
Open |
High |
Low |
|
May 20, 2014 |
24,376.88 |
24,555.31 |
24,587.16 |
24,299.53 |
|
May 19, 2014 |
24,363.05 |
24,340.32 |
24,448.47 |
24,107.99 |
|
May 16, 2014 |
24,121.74 |
24,271.54 |
25,375.63 |
23,873.16 |
|
May 15, 2014 |
23,905.60 |
23,809.42 |
23,971.78 |
23,742.75 |
|
May 14, 2014 |
23,815.12 |
23,897.88 |
23,964.67 |
23,753.36 |
|
May 13, 2014 |
23,871.23 |
23,729.78 |
24,068.94 |
23,729.25 |
|
May 12, 2014 |
23,551.00 |
23,031.11 |
23,572.88 |
23,008.65 |
|
May 09, 2014 |
22,994.23 |
22,374.98 |
23,048.49 |
22,317.18 |
|
May 08, 2014 |
22,344.04 |
22,382.14 |
22,443.13 |
22,277.04 |
|
May 07, 2014 |
22,323.90 |
22,488.96 |
22,532.82 |
22,286.26 |
|
May 06, 2014 |
22,508.42 |
22,512.23 |
22,602.71 |
22,475.65 |
|
May 05, 2014 |
22,445.12 |
22,412.80 |
22,592.03 |
22,354.45 |
|
May 02, 2014 |
22,403.89 |

Trending News
Top Headlines