CUET UG 2022 Results: Here Is How NTA Score Is Calculated. All About The Marks Evaluation Formula
Normalisation is important to ensure that candidates who attempt the tougher examination do not get lower marks compared to those who attempt the easier one, solely due to the difficulty of the paper.

CUET UG 2022 Results: The National Testing Agency (NTA) released the results of the Central Universities Entrance Test (CUET) conducted for admission to undergraduate courses in central universities on September 16, 2022. The results were expected to be announced on September 15 by 10 pm IST. Ahead of the results, the NTA released a notice which describes the procedure to calculate normalised scores from the raw scores for multi-session papers in the entrance examination. The CUET UG examination was conducted in six phases for multiple subjects.
The normalisation procedure is important because the difficulty levels of different sessions for a particular subject vary.
A committee headed by senior professors from the Indian Statistical Institute, Delhi University, and Indian Institute of Technology, Delhi, agreed upon a common formula to calculate the normalised score.
According to the notice, the normalisation procedure is important to ensure that candidates who attempt the tougher examination do not get lower marks compared to those who attempt the easier one, solely due to the difficulty of the paper.
How Is The NTA Score Calculated?
The raw score of each candidate, which is the score obtained before normalisation, in a particular subject will be normalised using the Equi-percentile method. Normalisation will be done separately for each subject for which the examination was held in multiple shifts.
The raw score for each candidate appearing for a subject will be converted into an NTA score (percentile score and normalised score) in three steps.
A percentile is a statistical measure indicating the value below which a given percentage of observations in a group of observations fall. For instance, if a candidate has 99 percentile, it means that 99 per cent of the candidates have scored below that candidate.
Step 1
Convert Raw Scores Into Percentile Scores
1. The percentiles are calculated separately for each shift. First of all, one must record the number of candidates who have appeared in a shift. The number of candidates who have appeared in a shift for a particular subject should be denoted by N.
2. After this, one must sort all the candidates in one shift in decreasing order of their marks.
3. Then, the raw marks for each candidate should be noted. The raw marks for each candidate can be denoted by the letter T.
4. One must count the number of candidates in that shift whose raw scores are less than or equal to T.
5. The number of candidates in a particular shift whose raw scores are less than or equal to T should be denoted by m.
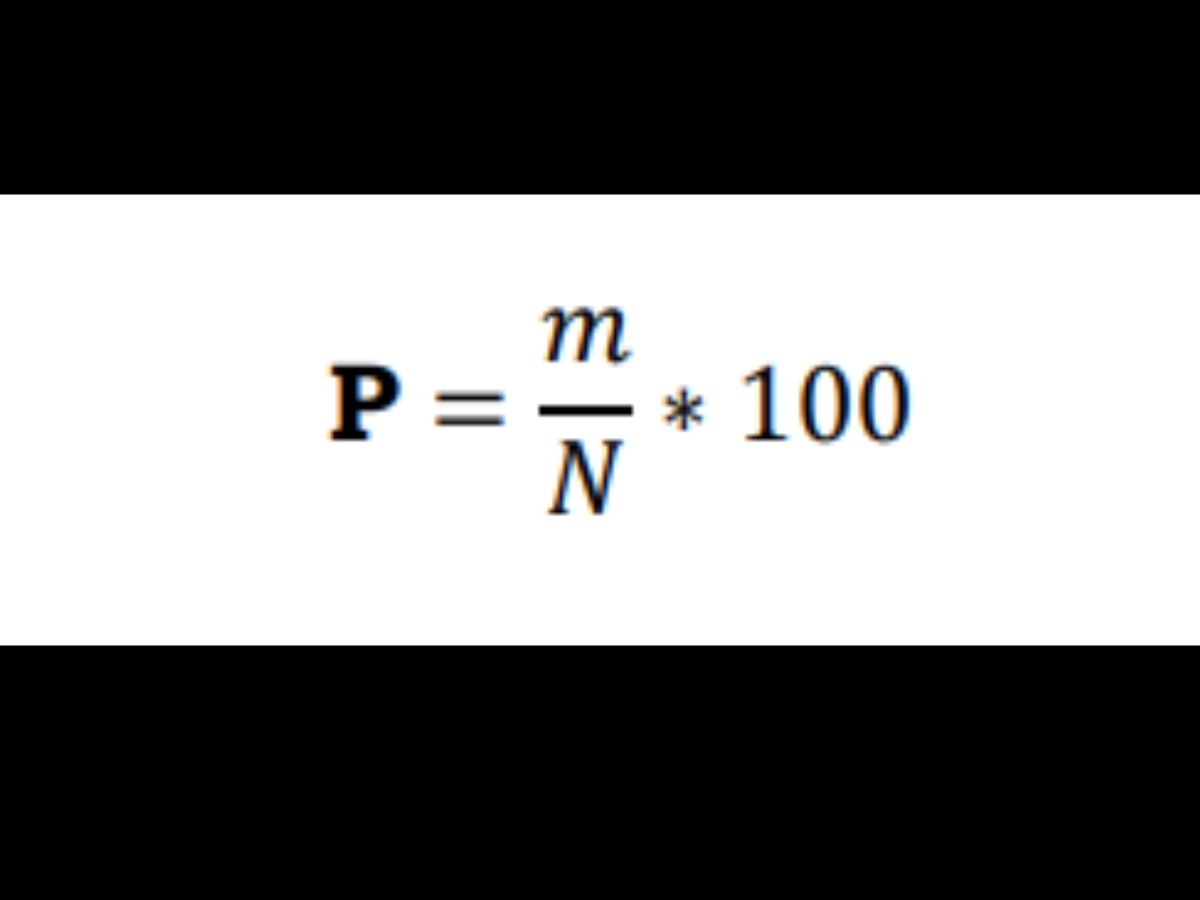
6. The percentile score must be calculated by dividing m by N, and then multiplying the value by 100.
In other words, the number of candidates in a particular session with raw scores equal to or less than the T score should be divided by the total number of candidates appearing in that session, and the value should be multiplied by 100, in order to obtain the percentile score.
Step 2
Calculate Interpolated Raw Scores For Each Candidate
1. In the second step, one must calculate the interpolated score of each candidate for the shift he or she did not appear in.
For instance, there are six candidates, namely A, B, C, D, E, and F. The subject they appeared in was conducted in two shifts, namely, Shift 1 and Shift 2.
Let us denote the percentile scores for A, B, C, D, E, and F, with PA, PB, PC, PD, PE, and PF, respectively.
Let us denote the raw scores of A, B, C, D, E, and F as xA, xB, xC, xD, xE, and XFrespectively.
Candidates A, B, and C appeared for the examination of a subject in Shift 1. Meanwhile, candidates D, E, and F appeared for the examination of the same subject in Shift 2.
2. The values should be tabulated. Four columns should be made. One of the columns should denote the name of the candidate. The other columns will be used to represent the corresponding percentile and Raw Score of each candidate.
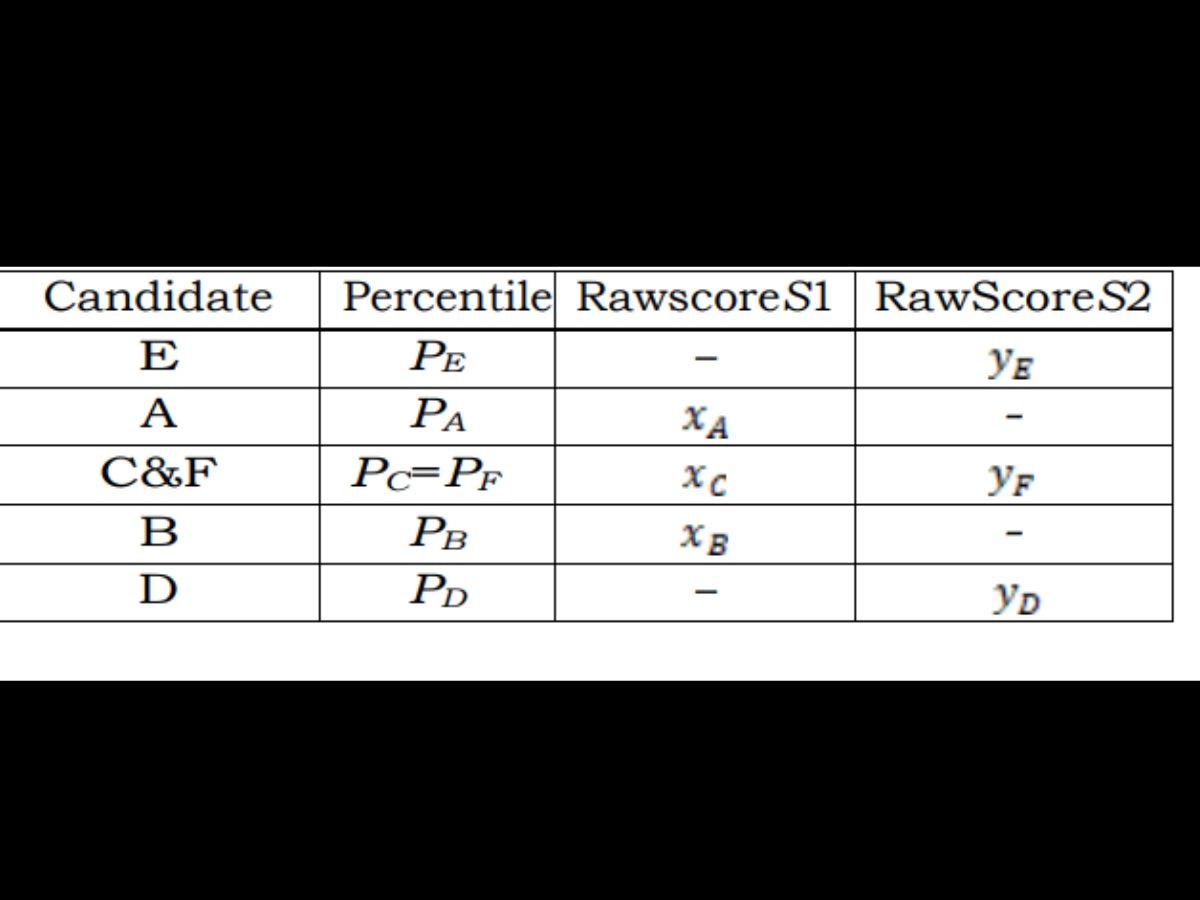
3. In the example we considered, PE is greater than PA. PA is greater than PC. PC and PF are equal. PF is greater than PB. PB is greater than PD.
PE>PA>PC=PF>PB>PD.
4. Candidate E will have a raw score only in the column Raw Score 2 because he or she did not appear for the exam in the first shift.
Candidate A will have a raw score only in the column Raw Score 1 because he or she did not appear in the second shift.
Candidates C and F have equal percentiles. This means that the raw score xC and xF are equal.
Candidate B will have a raw score in the column Raw Score 1 because he or she did not appear in the second shift.
Candidate D will have a raw score only in the column Raw Score 2 because he or she did not appear in the first shift.
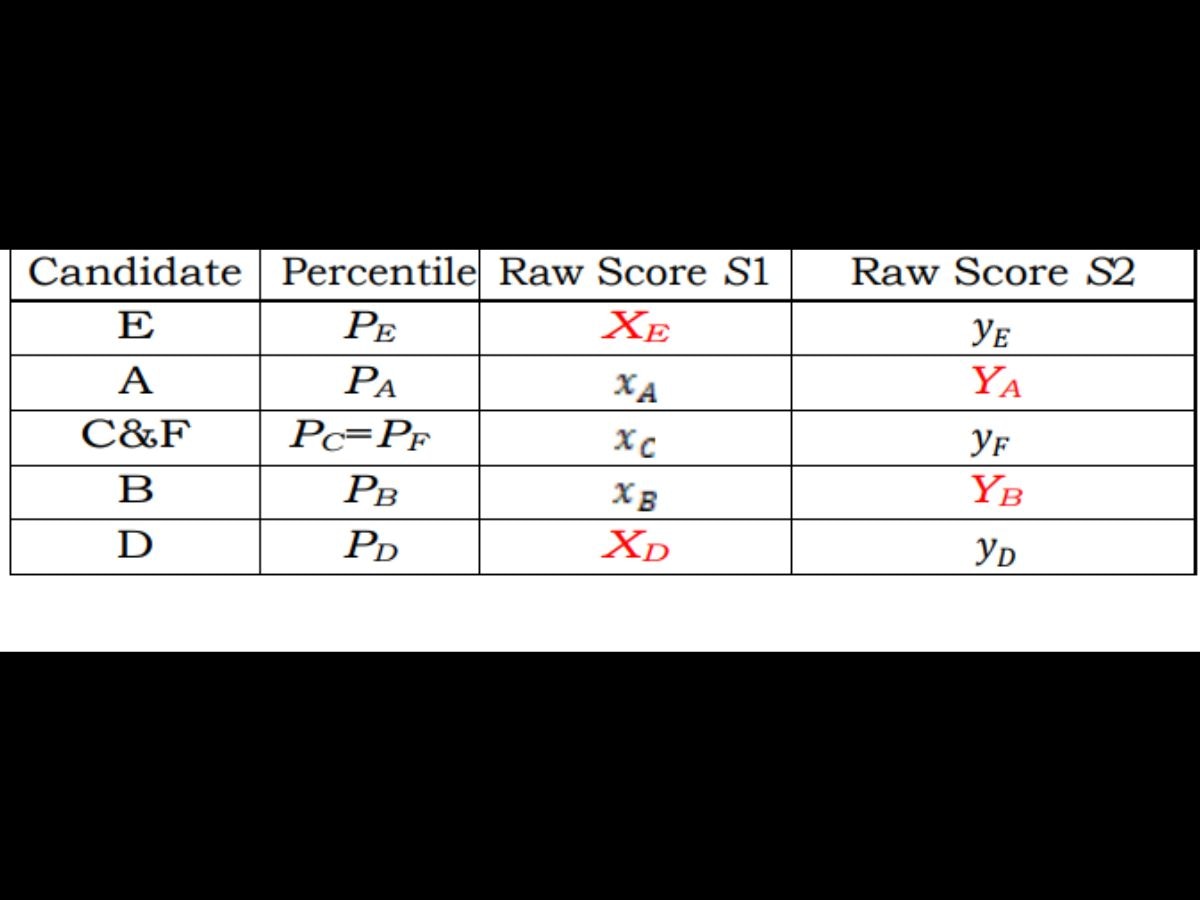
5. Now, the interpolated score must be calculated for each candidate. The interpolated score is represented by X. The cell which has been left blank for each candidate, because he or she did not appear in that shift, will be replaced by X.
X is calculated using the formula shown below.
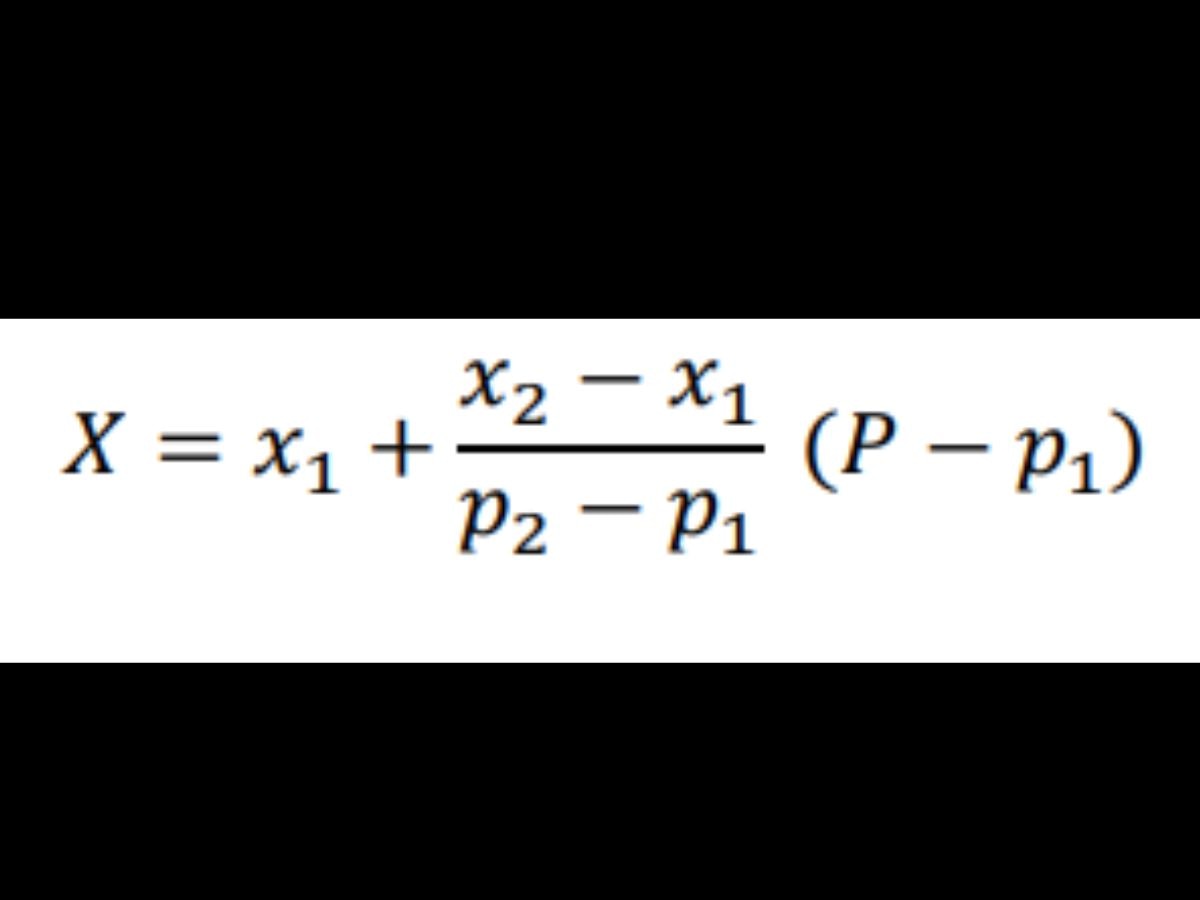
In the formula, P represents the corresponding entry in the percentile column. For instance, the percentile of C is PC.
The variable x1 denotes the first non-blank entry below X in the table. This means that x1 is less than X.
For instance, for candidate C the first non-blank entry below X is xB. Therefore, in the formula, one must enter xB.
The variable x2 is the first non-blank entry above X. This means that x2 is greater than X.
For candidate C, the first non-blank entry above X is xA. Therefore, one must enter the value of xA in the formula.
6. The variable p1 represents the entry in the "percentile" column corresponding to x1 from "Raw Score S1".
For candidate C, the variable p1 will be replaced by PB.
The variable p2 represents the entry in the "percentile" column corresponding to x2 from "Raw Score S2".
For candidate C, the variable p2 will be replaced by PA.
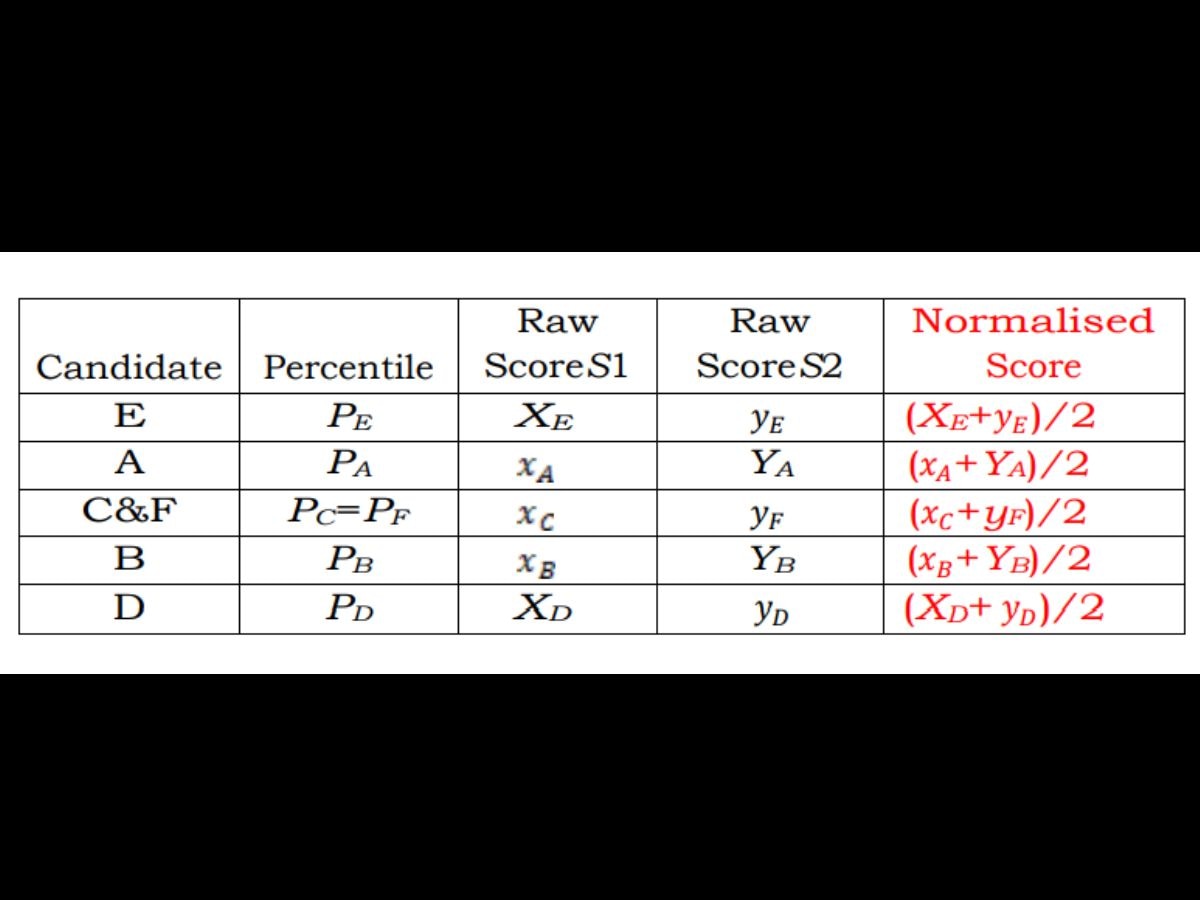
7. The percentile, raw score, and interpolated raw score of each candidate must be tabulated.
Step 3
Calculate Normalised Score
In the final step, the normalised score must be calculated. After the first two steps, each candidate was assigned a percentile value for each session conducted for a particular subject.
The Normalised score, denoted by Z, is calculated by finding the average of the raw scores of a particular candidate in all the sessions.
For instance, if a candidate scored S1 in shift 1, and his or her interpolated score in shift 2 is S2, the normalised score will be (S1 + S2)/2.
Therefore, the normalised score is calculated by dividing the sum of raw scores obtained by a particular candidate in a subject by the number of sessions conducted for that subject.
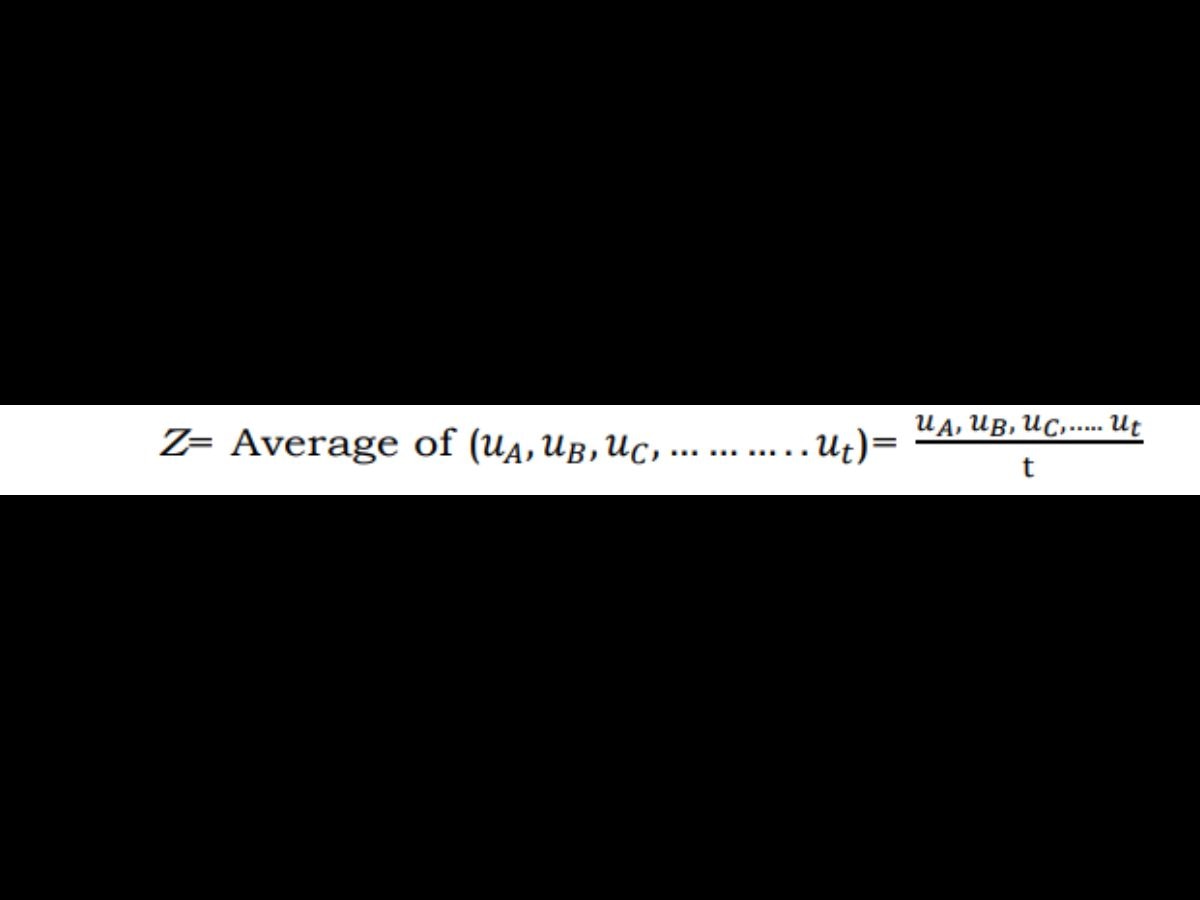
If four sessions are conducted for a particular subject, then, the candidate's raw scores in different sessions should be added, and the sum should be divided by four.
(With inputs from Ajatika Singh)
Education Loan Information:
Calculate Education Loan EMI
Related Video
Delhi Election Results 2025: Counting Begins; BJP Poised for Historic Comeback in Delhi, Exit Polls Suggest | ABP News


